Rolling the Numbers: Analyzing Patterns of Dice Rolling
Alicja Zajac
3/12/25
Abstract
Probability is a crucial aspect of mathematics, as it predicts the outcomes of certain events. This lab report aims to explore this concept through dice rolling. The focus being on the frequency and its distribution on the numbers 2 through 12, which represent all of the possible outcomes you may get out of a pair of dice. By rolling 2 six-sided dice 100 times we were able to determine that the number 7 appears most frequently in comparison to all of the other possible outcome sums.
Introduction
Have you ever wondered the probability of certain outcomes when rolling a pair of dice? The outcomes of this process may seem completely random, but they are in fact based on the likelihood of different combinations that could occur based on the numbers on the dice. In this lab, we will explore the principles of probability through rolling a pair of dice several times and analyzing the frequency of its outcomes. The purpose for conducting this experiment is in order to understand the patterns within the results which can help us gain insight on how probability could be used in statistical situations. Going into this experiment, I predict that the frequency of the rolled dice will end up more concentrated towards the center numbers rather than the outer numbers.
Materials
- 2 six-sided sided dice
- 1 sheet of paper
- 1 pen
Methods
- Procure 2 six-sided dice
- Place the dice in the center of the palm of your hand
- Set your remaining hand, cupped, on top of your previous hand leaving space in the
middle for the dice to move around - Shake your hands vigorously for a couple of seconds
- Release the dice onto a flat even surface
- Observe the outcome and record the sum of the two dice
- Repeat steps two through six 99 more times
Results
The following diagrams represent the data collected after conducting the experiment in the forms of a data table and bar graph. The data in these illustrations represents the added scores of the dice and the frequency of which they occur.
Data Table
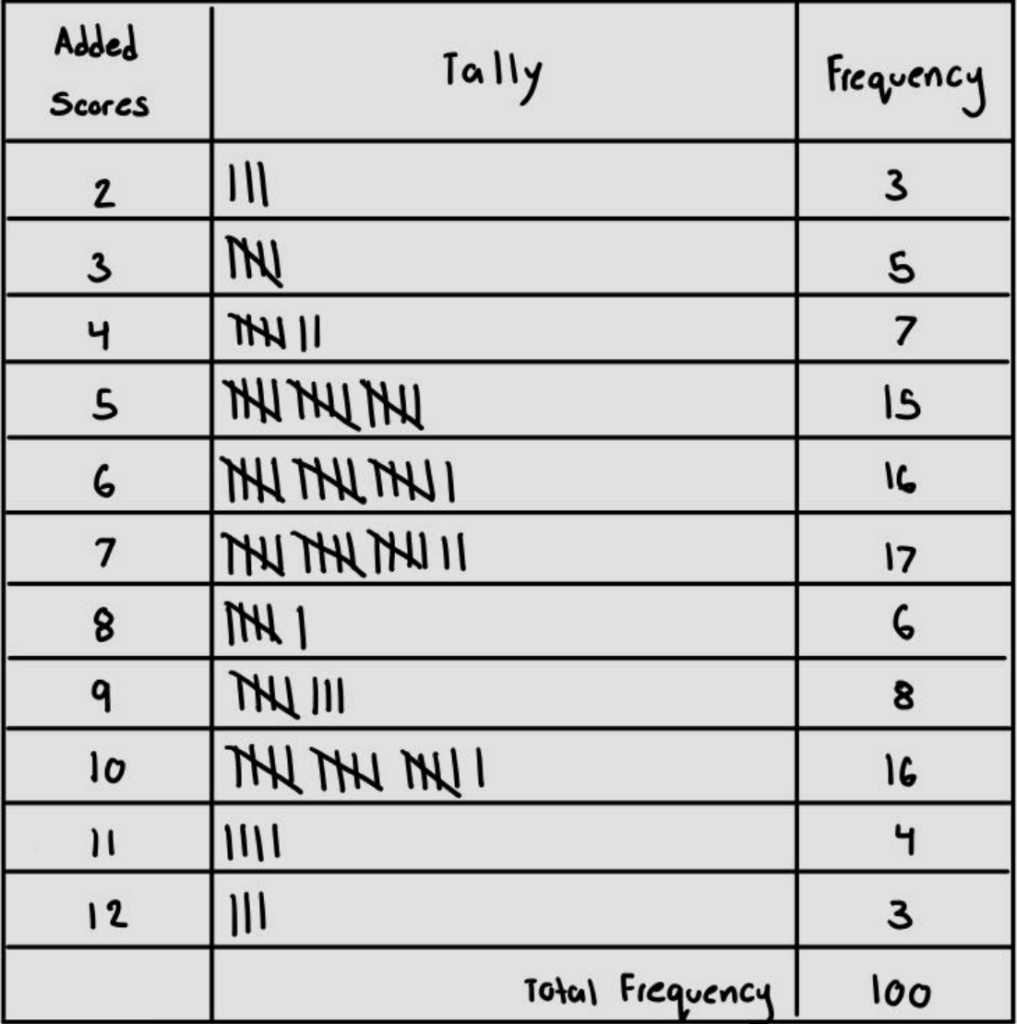
Figure 1 – observed outcomes of the results after rolling the dice 100 times
Bar Chart
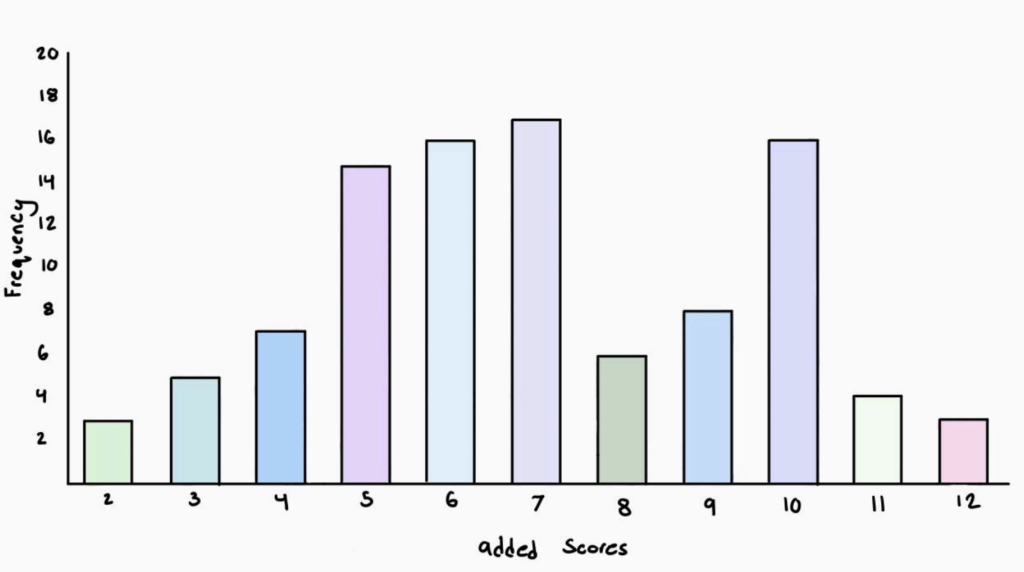
Figure 2 – data from figure 1 imputed into bar chart form
Analysis
The results from this experiment did end up aligning with my hypothesis. As you can see from figures 1 and 2, rolling a 7 was the highest frequency out of all of the other possible numbers you could roll. The numbers that followed with having larger frequencies than the rest of the data are 10, 6, and 5. Although the largest frequencies were not all exactly concentrated in the center, all of the middle values did end up having larger frequencies than both ends of the data. The reasoning behind this phenomenon is that there are more combinations of dice rolls that would result in a sum of 7 than any other number in the total possibilities. The same goes for all of the center values with the chances of rolling lower or higher values decreasing as you get to the two ends of the data.
A study was done by Jonathan D. Baker on dice probability, more specifically the patterns that occur when adding more dice into the experiment. In his paper Rolling the Dice he states, “A single die of any number of sides will yield a uniform distribution of outcomes, and a pair of dice of any number of sides will produce a triangular distribution. We begin to see a more general and typical shape as we add a third die (see fig. 6b), but more dice reveal a picture that tends toward the limiting case of a normal distribution (see figs. 6c and 6d).” (Baker, 2013). This relates to my study as it shows how in all cases of rolling two dice you will receive a triangular shaped distribution with a higher chance of getting central numbers meaning that there is always a higher probability of rolling numbers around 7. He also adds that if you were to continue to add dice to the equation you would get more of a normal distribution of numbers creating a bell curve shape and producing even fewer extremes.
Conclusion
As you can see, the outcomes of the experiment showed us that when rolling two dice simultaneously you have a higher probability of producing central numbers rather than higher or lower values. This is as a result of having more possible combinations of numbers that will get you the sum of those numbers in comparison to the extremes. If you wanted to continue this experiment and see the results of different factors in dice rolling you could possibly consider adding more dice into the equation, adding dice with differing amounts of sides, or even using a computer program to determine the probability of dice rolling. This information within the study could be useful for understanding patterns statistically, predicting outcomes in games, as well as exploring different concepts in statistics.
References
Baker, J. D. (2013). Rolling the Dice. Retrieved from
https://www-jstor-org.ccny-proxy1.libr.ccny.cuny.edu/stable/pdf/10.5951/mathteacher.10
6.7.0551.pdf?refreqid=excelsior%3A8c528774d33d2795516dfc7c2324f2aa